Thinking about buying or selling in Newport Beach and wondering what prices, inventory, and days on market really mean for your timing and bottom line? You are not alone. With a mix of move-up homes and world-class luxury estates, this coastal market behaves differently than most of Orange County. In this guide, you will learn how these indicators work in Newport Beach, how they shift by season and neighborhood, and how to use them to make clear, confident decisions. Let’s dive in.
Market snapshot
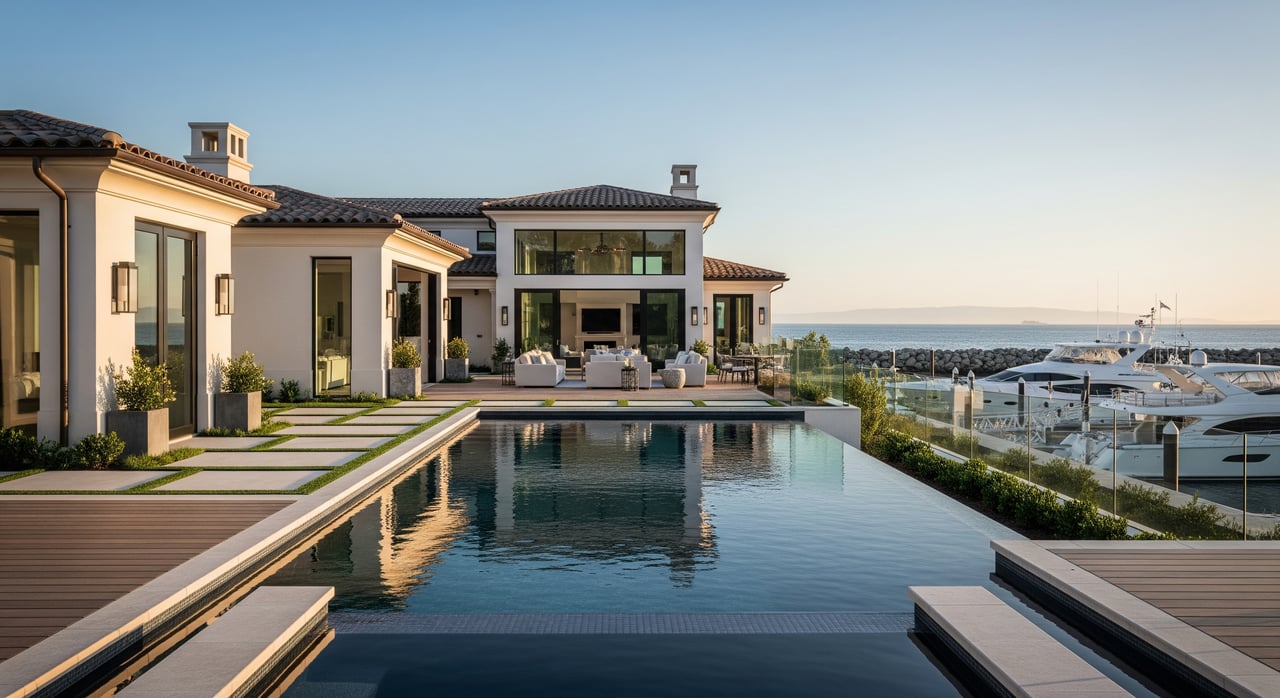
Newport Beach is a high-priced coastal market with two distinct tiers: mainstream single-family homes and condos, and a smaller but very active luxury tier that includes oceanfront, bluff-top, and gated-community estates. After sharp price gains during the pandemic years, recent conditions have moderated in response to higher mortgage rates, yet premium coastal pockets have stayed resilient. The result is a market where quality listings still move well, while overpricing can lead to longer market times.
What drives price and pace
- Inventory scarcity of desirable coastal lots and detached homes limits new supply.
- Interest rates influence demand. Rate increases since 2022 cooled some segments, while rate cuts or expectations can spur quick bursts of buyer activity.
- Seasonality matters. Spring and early summer tend to bring more new listings and active buyers.
- Wealth effects shape luxury demand. High-end buyers often respond to stock market performance and liquidity events.
- Lifestyle premiums like proximity to the beach, marina access, and views create meaningful price differences across neighborhoods.
Data caveats that matter
- Luxury metrics can swing dramatically because a few large sales can skew medians and averages.
- Off-market and quiet sales are more common at the high end and may not appear in public summaries.
- Public data portals and MLS feeds can show different numbers due to updates and methods. Use consistent windows and rolling averages to smooth volatility.
Prices by property type and area
Prices vary widely by home type and micro-location. Think in ranges and momentum, not single-point numbers, especially in the luxury tier.
Single-family homes
Citywide, detached homes typically sit in the multi-million-dollar range. Median values in many neighborhoods reach the low-to-mid millions, while prime areas trend higher. Condition, outdoor space, and view corridors can move value significantly even within the same tract.
Condos and townhomes
Condominiums and townhomes trade at a discount to detached homes, yet they remain expensive for the county. Many Newport Beach condos fall in the mid-six-figure to low-seven-figure range depending on location, HOA amenities, finishes, and proximity to the water.
Luxury and oceanfront
Luxury estates and oceanfront properties commonly sell from several million to tens of millions. Price per square foot on oceanfront or bluff lots ranks among the highest in Orange County. Because samples are small and homes are unique, use 3 to 6 months of comparable sales and rolling averages to understand momentum.
Neighborhood premiums
- Corona del Mar and Newport Coast often achieve some of the highest price-per-square-foot figures, helped by new construction, gated enclaves, and commanding views.
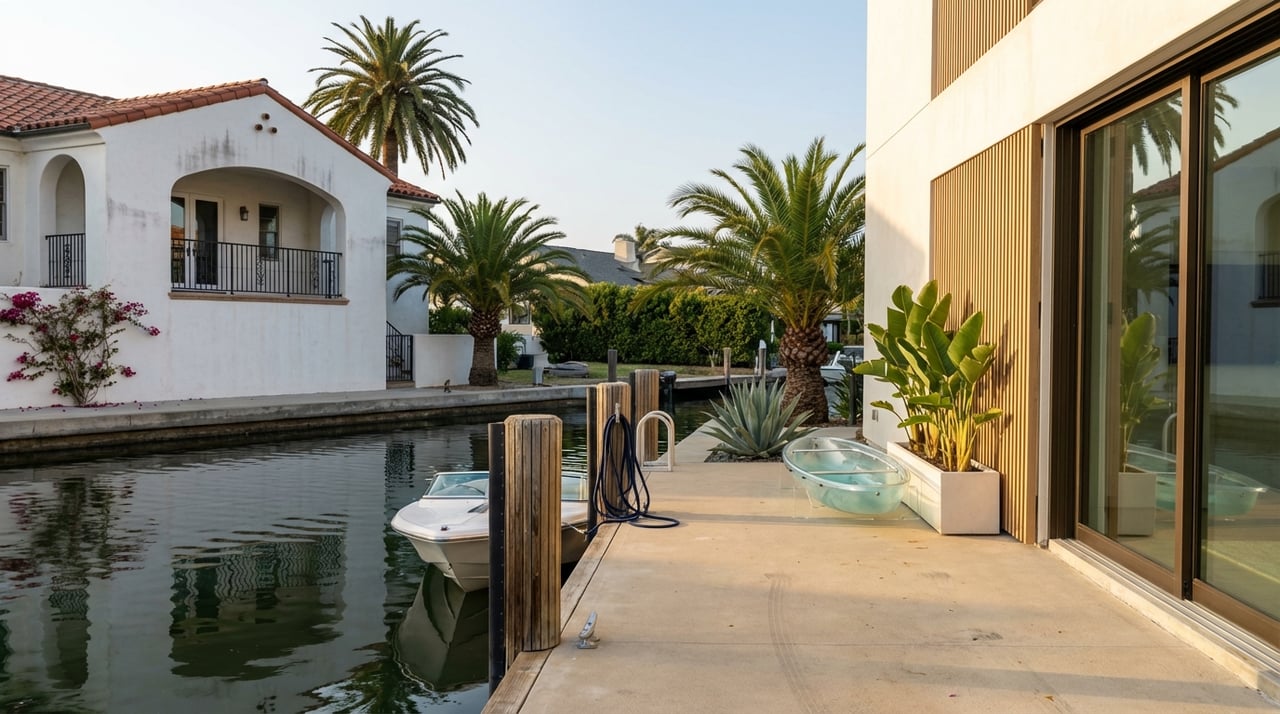
- Balboa Island and the Balboa Peninsula show strong premiums for direct water access and island living. Narrow-lot homes and private docks create unique valuation cases.
- Harbor-area neighborhoods and Lido Isle offer a mix of luxury and mid-market homes with marina access and varied price bands.
- Direct ocean or harbor views typically command a meaningful premium. A conservative rule of thumb is a 20 to 40 percent uplift for unobstructed water views or access, though the exact premium depends on micro-location and property condition.
Inventory and seasonality
Inventory in Newport Beach ebbs and flows with the calendar and the rate cycle. The quality and condition of what is available also matter as much as the raw count.
What to expect by season
- Spring (March to May): often the most active listing and buying window. Inventory rises and well-prepared listings see strong engagement.
- Summer (June to August): activity remains solid near the coast, with out-of-area and second-home demand mixed in.
- Fall (September to November): a gradual taper in both new listings and buyer traffic.
- Winter (December to February): typically the lowest new listing volume and slower pace overall.
Months of inventory explained
Months of inventory, or MOI, equals active listings divided by recent monthly sales. In hot coastal markets, MOI can sit under 3 months, which favors sellers. A MOI above 6 months suggests buyer-friendly conditions. In Newport Beach, MOI changes by neighborhood and price tier. Luxury segments can show higher MOI simply because the qualified buyer pool is smaller.
Days on market trends
Days on market, or DOM, measures how long a listing takes to secure an accepted offer. In Newport Beach, DOM depends on price, presentation, and season.
Typical selling times
- Well-priced, mainstream single-family homes often sell within 30 to 60 days in a balanced-to-competitive environment.
- Condos and townhomes can be similar or slightly longer depending on price point and HOA dynamics.
- Luxury and oceanfront properties typically take longer. Many sell in 60 days or more, with unique estates sometimes requiring several months.
What affects days on market
- Accurate pricing is critical. Overpricing usually leads to a rising DOM and later price reductions.
- Marketing and exposure matter. High-end properties benefit from targeted outreach, broker networks, and international reach. Poor targeting increases DOM.
- Financing conditions can narrow the buyer pool at certain price points, lengthening market times.
Sale-to-list ratio and price cuts
Sale-to-list ratio shows negotiation pressure. Ratios above 100 percent suggest multiple-offer or over-asking outcomes. Around 98 to 100 percent indicates balanced conditions. Readings below 98 percent point to softer demand and more room for concessions. Luxury listings often post lower sale-to-list ratios than mainstream homes because of their smaller, more deliberate buyer pool.
Negotiation takeaways
Whether you are selling or buying, use MOI, DOM, and sale-to-list ratio together. They reveal where leverage sits right now in your specific segment.
If you are selling
- Compare your neighborhood’s current MOI, DOM, and sale-to-list ratio over the last 3 to 6 months against the prior year. Declining DOM and low MOI signal a favorable listing window.
- Price within the range of recent comparable sales while considering momentum from the last 60 to 90 days.
- Elevate presentation. In low-inventory stretches, well-staged and well-marketed listings pull forward demand and reduce DOM.
If you are buying
- Watch trend lines for new listings and MOI. Rising MOI and longer DOM often mean more negotiating room on price and terms.
- Look for signals of motivation, such as price reductions or extended market times, especially in the luxury tier.
- Contingencies are leverage. In softer windows, you may secure full inspections and appraisal protections and still close on a fair timeline.
Smart pricing and contingencies
- In seller-favored conditions, expect tighter timelines and fewer concessions. If you are selling, you can focus on clean terms and a strong sale-to-list outcome.
- In buyer-favored conditions, prioritize due diligence. Extend timelines as needed and negotiate repairs or credits where data supports it.
- Closing timelines are a tool. Fast closings can win in competitive scenarios, while extended closings can be a buyer concession in slower markets.
How to read the data
Use these simple definitions to turn metrics into decisions:
- MOI (Months of Inventory): Active listings divided by recent monthly sales. Lower MOI favors sellers, higher favors buyers.
- DOM (Days on Market): Days from listing to accepted offer. Falling DOM signals quicker market velocity.
- Sale-to-List Ratio: Final sale price divided by list price. Above 100 percent implies competitive bidding. Around 98 to 100 percent is balanced. Below 98 percent suggests softening.
- Price per Square Foot: Useful for neighborhood comparisons, but adjust for condition, lot, and view. Use rolling averages in luxury segments to smooth volatility.
Next steps in Newport Beach
Newport Beach is not a one-size-fits-all market. Citywide averages can hide big differences between Corona del Mar, Newport Coast, Balboa Island, the Peninsula, and harbor-close streets. The best choices come from neighborhood-level comps, rolling trend analysis, and a clear plan for pricing, presentation, and negotiation.
If you are weighing your timing, let’s translate these indicators into a tailored strategy for your address or target search. With design-forward marketing, negotiation expertise, and access to off-market opportunities, you can move with confidence at the coast. Connect with Kathy Klingaman to align on your next move.
FAQs
What is the Newport Beach market and who drives it?
- Newport Beach is a high-priced coastal market with two tiers: mainstream single-family and condos, and a smaller luxury tier. Demand is shaped by limited supply, interest rates, seasonal patterns, and wealth effects at the high end.
What price ranges can I expect for condos and single-family homes?
- Condos and townhomes often sell from the mid-six figures to low-seven figures, while single-family homes generally sit in the multi-million-dollar range. Exact values depend on location, condition, and proximity to the water.
How long do Newport Beach luxury homes usually take to sell?
- Luxury and oceanfront properties often take longer than mainstream homes, with many selling in 60 days or more. Unique estates can require several months due to smaller buyer pools and tailored marketing.
When is the best season to list a home in Newport Beach?
- Spring and early summer typically bring the most listings and buyers, which can shorten market time for well-prepared homes. Fall and winter usually see fewer listings and slower activity.
What does months of inventory mean for buyers here?
- Lower MOI suggests seller leverage and faster sales, while higher MOI points to more negotiating room for buyers. MOI varies by neighborhood and price tier, especially in the luxury segment.
How big is the premium for water views or access?
- Properties with direct ocean or harbor views often command a premium that can be in the 20 to 40 percent range, though the exact uplift depends on micro-location, lot, and home condition.